 |
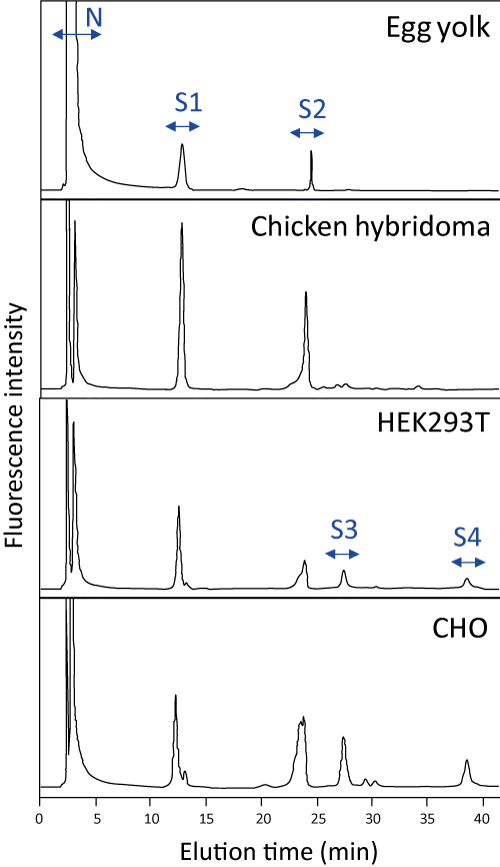
| Figure 1: N-glycosylation profiles of egg yolk IgY and monoclonal IgYs expressed by different production vehicles (chicken hybridoma, HEK293T and CHO cells), on a DEAE column. The PA-glycan mixture was separated according to sialic acid content. N denotes neutral fractions and S1, S2, S3, and S4 denote the fractions containing mono-, di-, tri-, and tetrasialyl oligosaccharides, respectively. |