 |
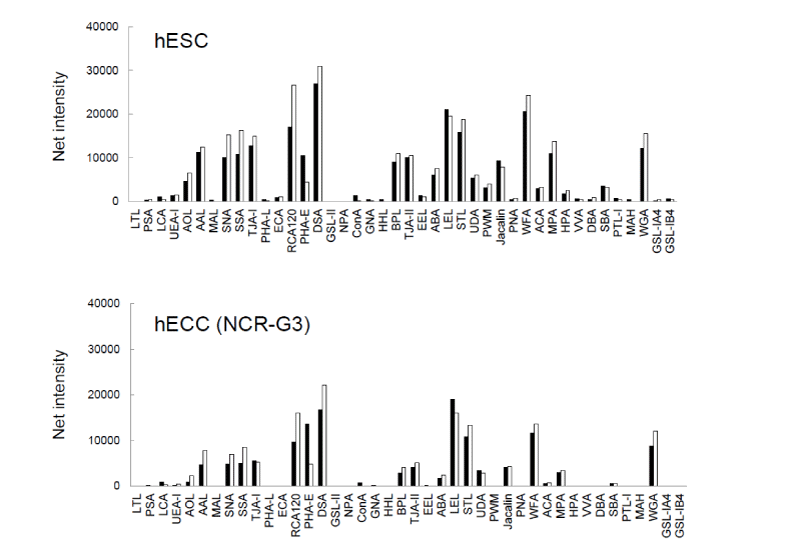
| Figure 1: Bar graph representation of 42 lectin signals of hESCs and hECCs (NCR-G3) with or without N-glycosidase treatment. Lectin microarray data are shown as net intensity. The signal intensities obtained for soluble extracts from hESC and hECC (NCR-G3) with and without N-glycosidase treatment are shown in open and closed bars, respectively. |