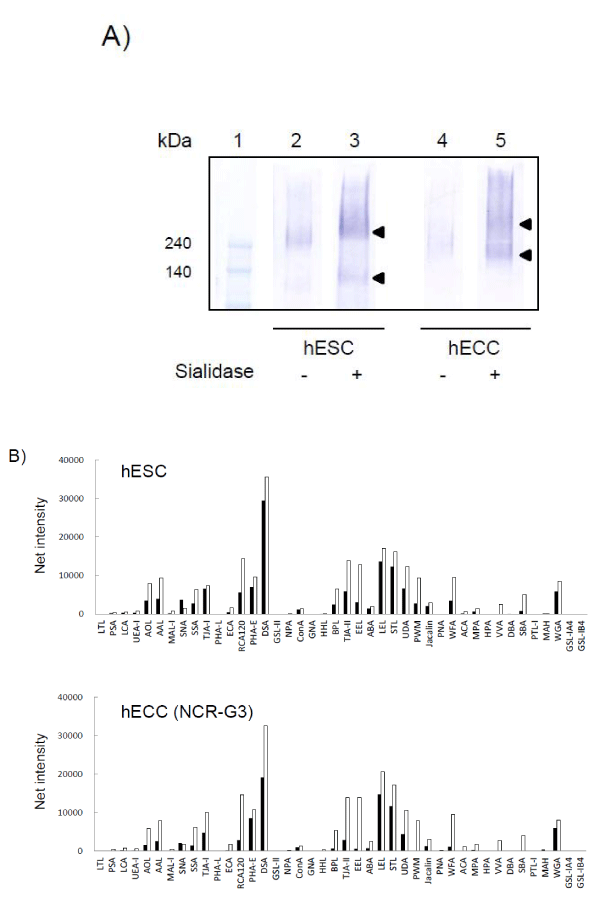
A) Podocalyxin in each cell extract was immunoprecipitated and subjected to western blot analysis. The immunoprecipitates from hESCs (lane 2) and hECCs (lane 4) were run on SDS-PAGE, and were reacted with anti-podocalyxin pAb. To see the effect of sialylation, the precipitates were treated with sialidase and were analyzed similarly for hESCs (lane 3) and hECCs (lane 5), respectively.
B) Bar-graph representation of 42 lectin signals obtained for hESCs and hECCs by the ALP procedure with or without the sialidase treatment. Lectin microarray data are shown as net intensity without normalization. The data obtained with and without the sialidase treatment are shown as open and closed bars, respectively.