 |
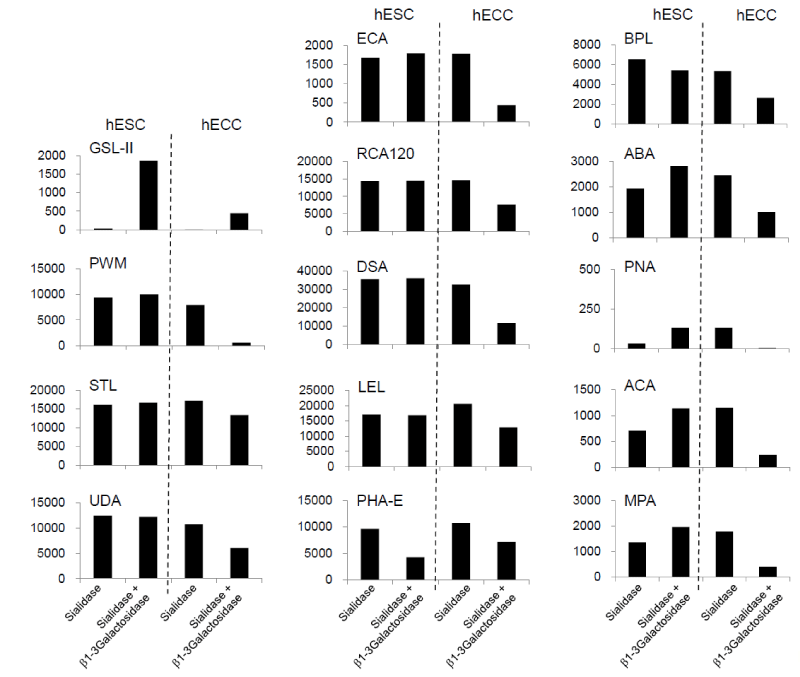
| Figure 4: Summary of changes in net signal intensities of lectins after glycosidase treatments. The results of 14 lectins are shown in net intensities, which showed significant difference in either hESCs or hECCs after sialidase and the subsequent ß1-3galactosidase digestion. |