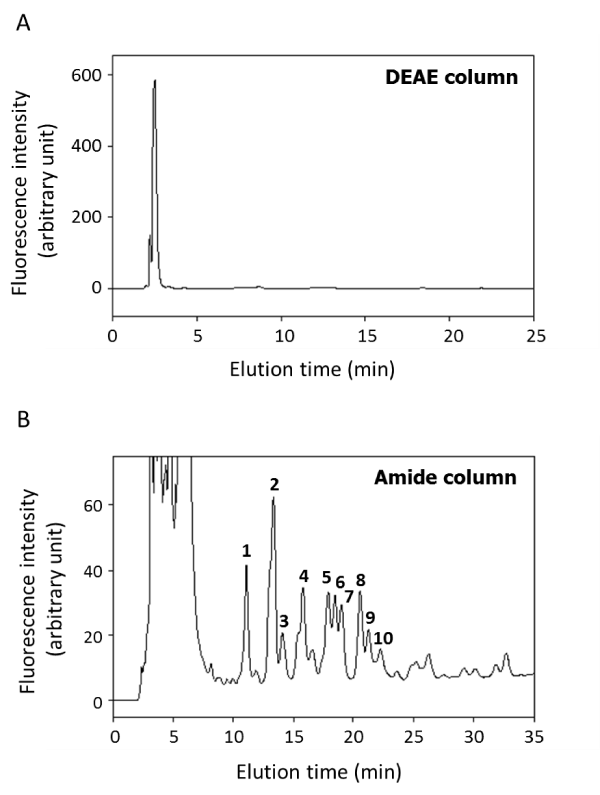
Elution profiles on DEAE column (A) and amide column (B) are shown. The void fraction on DEAE column was subsequently applied to the amide column and the peaks are numbered from 1 to 10.
 |
| Figure 4: HPLC profiles PA-glycans derived from pig kidney Na+/K+-ATPase.
Elution profiles on DEAE column (A) and amide column (B) are shown. The void fraction on DEAE column was subsequently applied to the amide column and the peaks are numbered from 1 to 10. |