 |
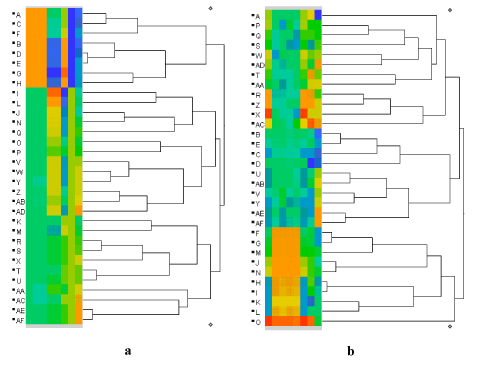
| Figure 3.1.1: The results of two cluster analyses. Figure 3.1.1 (a)consists of 32 items (8-tuples) of simulated uniform (0,1) variateswith a high degree of clustering induced by the constraint of perfectagreement between variates in 25% of the cases. Figure 3.1.1 (b)consists of 32 8-tuples simulated based upon functions of Gaussianvariates and linear combinations of a subset of the componentsof each item. |