 |
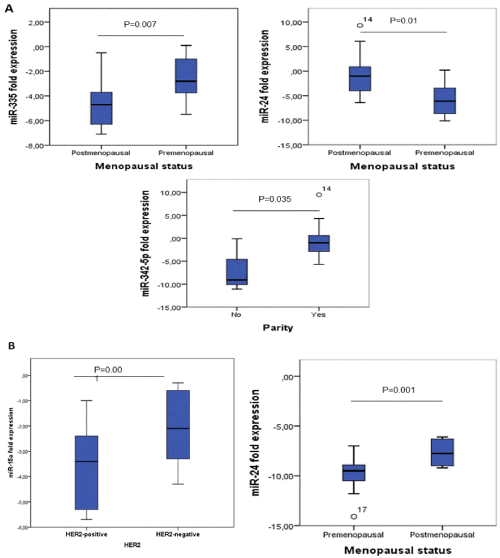
| Figure 1: Serum miRNAs levels in patients with IBC and non-IBC. The box plots show : A) the fold change of the significantly differentially expressed miR-335 and miR-24 upon non-IBC groups based on menopausal status and miR-342-5p based on parity profile; B) the fold change of the significantly differentially expressed miR- 15a and miR-24 upon IBC groups according to HER-2 and menopausal status respectively. The differences in serum levels were evaluated using the Mann-Whitney U test, and p values are indicated above the plots. |