|
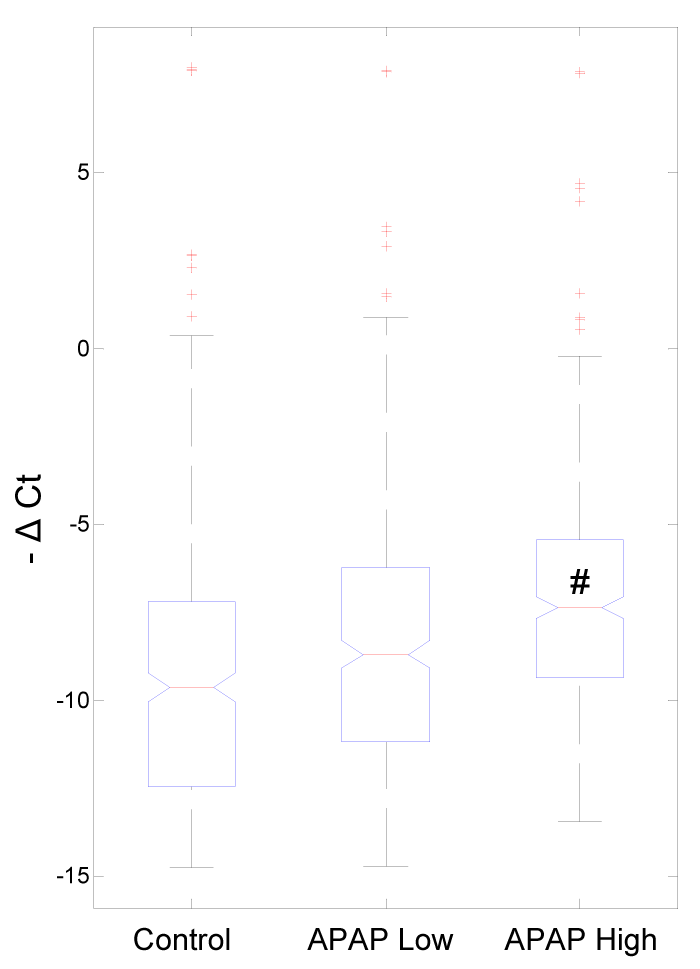
| Figure 1: Box plot of global urinary miRNA levels in control, 100 mg/kg APAP (Low) and 1250 mg/kg APAP (High) groups. Global miRNA (370 rat miRNAs on the PCR array) level from each group was reported as average ΔCt normalized with miR-193, miR-323*, and miR-675. #: APAP high dose group showed an increase in the global miRNA levels (p < 0.01, t-test). |