 |
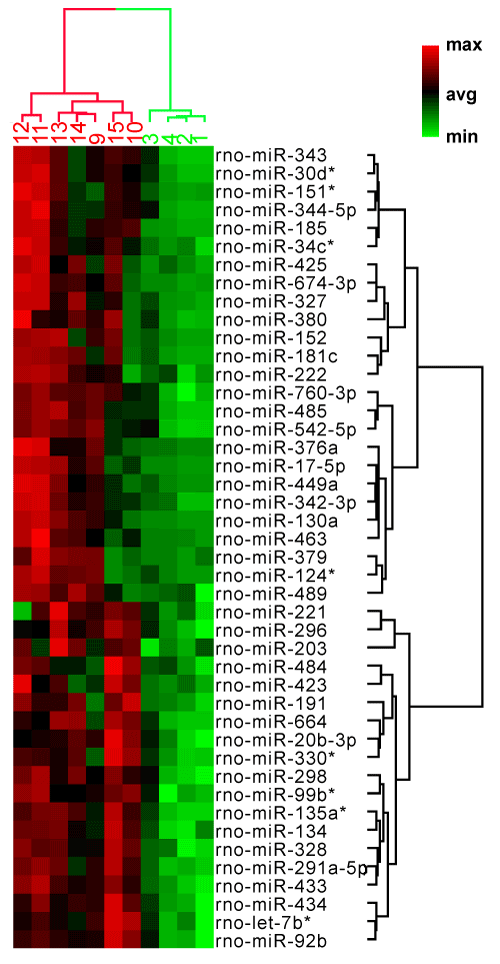
| Figure 2: Hierarchical clustering analysis of 44 differentially affected urinary miRNAs. The Welch’s t-test (p < 0.01) was used to identify the significantly changed (ΔCt value) urinary miRNAs at 24h after APAP dosing. The figure shows the clustering analysis of the 44 miRNAs that showed a >1.5-fold change between control (green animal numbers) and 1250 mg/kg APAP high dose group (red animal numbers). Relative miRNA concentration was reported as 2-ΔCt and the progressively brighter shades of red indicate higher miRNA levels; whereas, the green indicates lower levels. The identities of miRNAs are listed on the right and the animal numbers are on the top in color. |