|
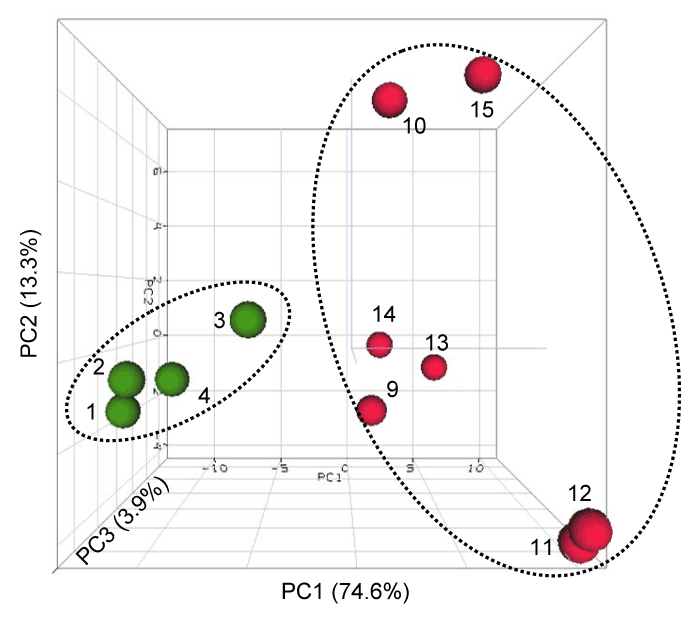
| Figure 4: Principal component analysis of 44 differentially affected urinary miRNAs. Samples from the controls are indicated in green and samples from the 1250 mg/kg APAP high dose group are in red. The animal numbers are adjacent to the markers. The Welchs t-test (p < 0.01) was used to identify the significantly changed (ΔCt value) urinary miRNAs at 24h after APAP dosing. The control and APAP high dose groups are separated along the first principal component (74.6%). |