 |
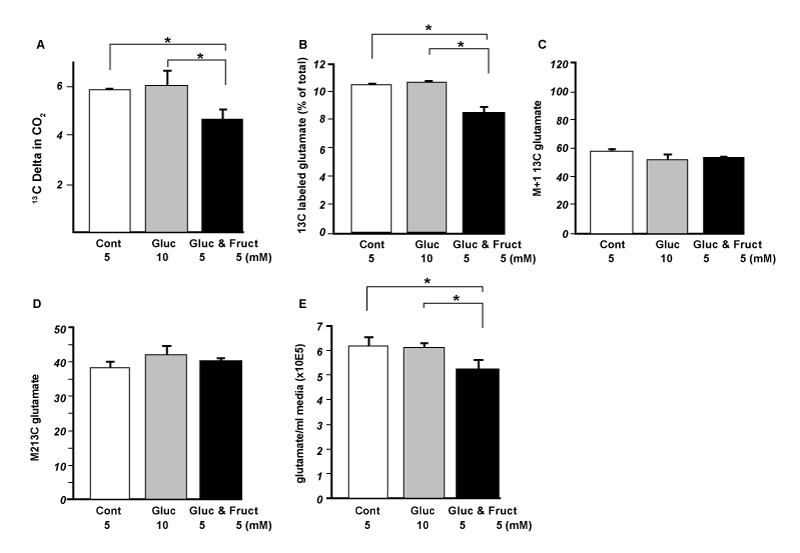
| Figure 1: TCA cycle’s adaptation in HepG2 cells following glucose- or fructose- treatment. Glucose (Gluc; 5 mM, middle dark bars) or fructose (Fruct; 5 mM, dark bars) was added to the baseline 4.5 mM glucose (Cont; 4.5 mM glucose, white bars). Ten percent (0.5 mM) glucose was supplied in the form of [1,2-13C2]-D-glucose as the single metabolic tracer in each culture and replaced every 24-h for a total of 72 hours culture. A, Complete glucose oxidation 13CO2 Delta, which is the excess 13C in released CO2 from HepG2 cells; B, 13C labeled glutamate fraction as percent of total unlabeled glutamate in the media; C, Media glutamate M+1 Sµ?2-?5 (one 13C substitution, m/z 198 fragment, electron impact ionization) of its 13C labeled fraction; D, Media glutamate M+2 SµΧ2−Χ5 (two 13C substitutions, m/z 198 fragment, electron impact ionization) of its 13C labeled fraction; E, Media glutamate concentrations as integrated chromatographic peak area (arbitrary values); (n=3; *p < 0.05). |