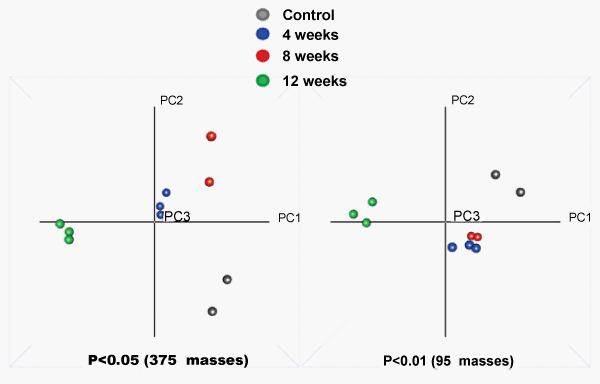
This analysis was based on the data from an F-test comparison of all samples with a p-value < 0.05 (left panel, 375 masses, log2 scaled) and a p-value < 0.01 (right panel, 95 masses, log2 scaled). Groups are indicated in the legend between the PCA plots. Separation was observed between early (control to 8 weeks) and late time points (12 weeks) along PC1. Controls and week 4, 8 samples were separated along PC2.