 |
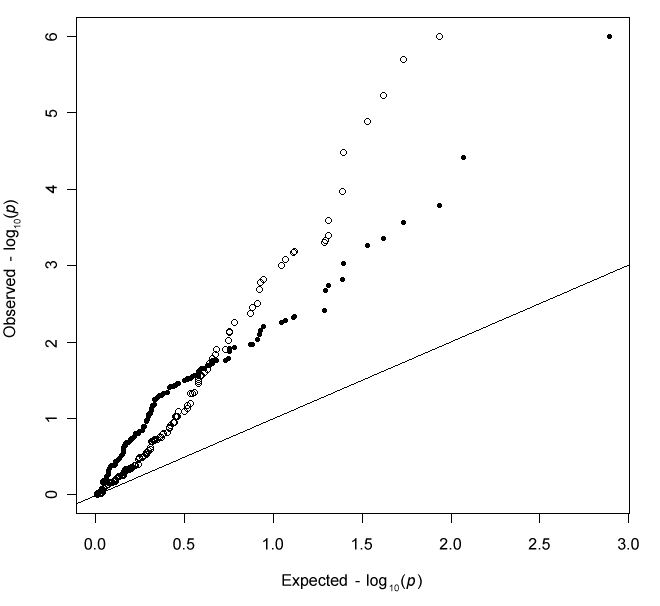
| Figure 1: Q-Q Plot of p values from single-metabolite linear regression analyses. P values for the association between sex and single metabolite concentrations were obtained from linear regression models of log-transformed metabolites regressed on sex, while, at a later stage, additionally adjusting for age, waist-to-hip ratio, HDL cholesterol level and smoking status. Open circles: unadjusted model; filled circles: adjusted model. |