 |
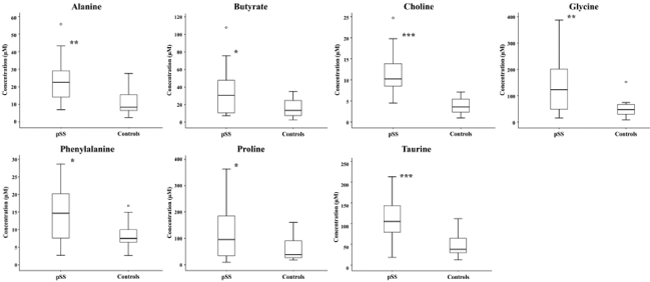
| Figure 2: Box- and whisker plots illustrating concentrations of some of the measured salivary metabolites in primary Sjogren’s syndrome (pSS) patients (n = 15) relative to healthy controls (n = 15). The median is depicted with a horizontal line in the middle portion of the box. The bottom and top boundaries of the boxes represent the first and third quartiles, respectively, and whiskers represent 95th and 5th percentiles. Significant differences were calculated using Mann-Whitney U-test (*P<0.05; **P<0.01; ***P<0.001). |