|
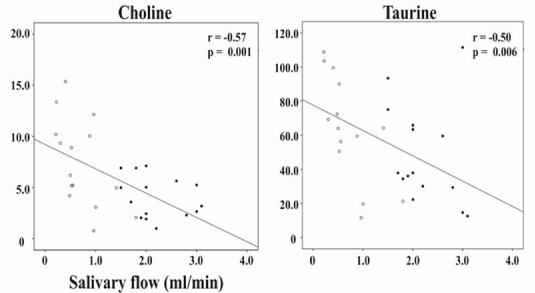
| Figure 3: The correlations between the salivary flow rate and concentration of choline and taurine. pSS patients (n=15) are marked by open circles and healthy controls (n=15) by black squares. The solid line represents the linear regression curve of the best fit. r = Spearman’s correlation coefficient. |