|
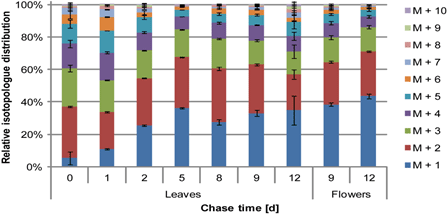
| Figure 7: Relative isotopologue distribution (excess) of thymol analyzed by GC-MS. Thymol was extracted with chloroform from T. transcaucasicus leaves and flowers at different points of time after the labelling with 13CO2 for 4 hours (see Experimental). Excess values were obtained by subtracting the natural 13C abundance of 1.11%. The M+1 bar in the diagram represents molecules carrying only one 13C atom (position unknown), the M+2 bar stands for molecules carrying two 13C atoms, and so on. |