 |
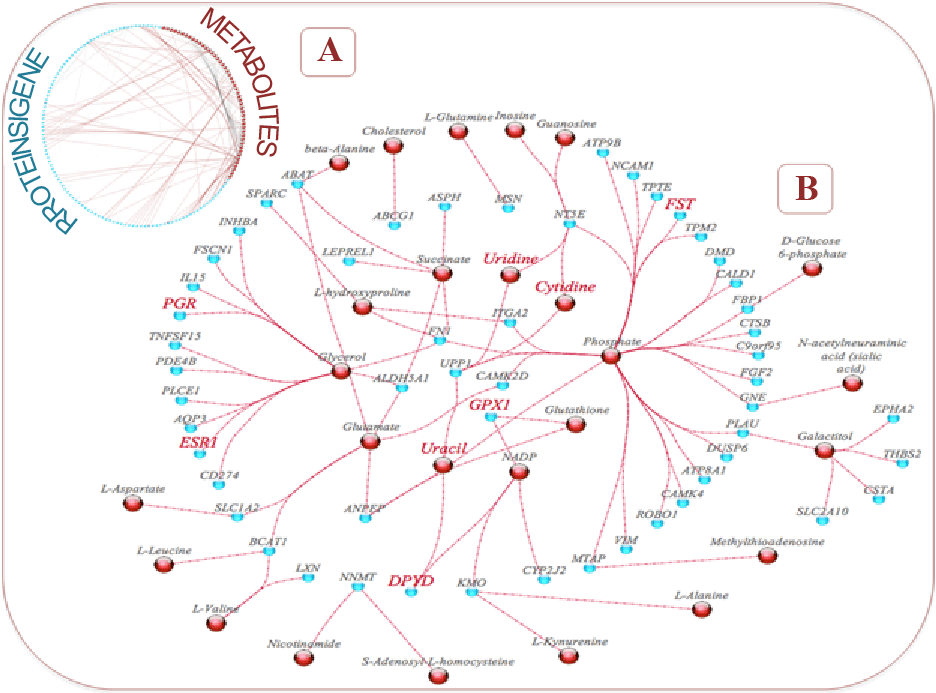
| Figure 3: The integrative knowledge-driven network combining two ‘omics’ technologies including microarray gene expression and metabolomics.A) the circular view of entire network showing gene-to-metabolite, gene-to-gene and metabolite-to-metabolite interactions. The network is color-coded with nodes in red color corresponds to metabolites and cyan color genes. Node label highlighted in red color corresponds to CTD curated genes and metabolites associated with breast cancer. Grey color solid edges corresponds to undirected gene-to-gene and metabolite-to-metabolite interactions, and dotted red color undirected gene-to-metabolites interactions. B) Sub-network view showing exclusive gene-to-metabolite interactions to gain novel insights into the molecular mechanisms of breast cancer dynamics. |