 |
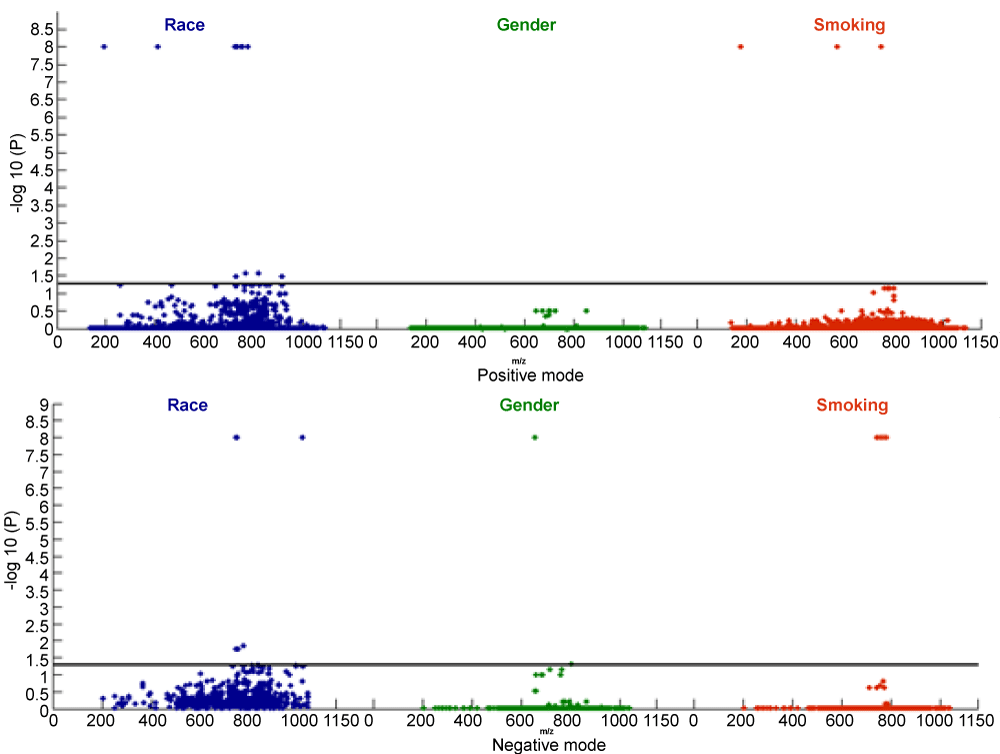
| Figure 2: Scatter plots of P-values from ANOVA with BH correction, based on data from (a) positive ionization mode and (b) negative ionization mode. Points above the bold line indicate a BH-adjusted P-value less than 0.05. (Points were truncated at a P-value of 10-8). |