 |
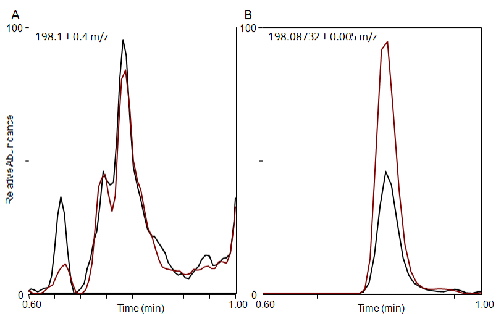
| Figure 4: ESI+ extracted ion chromatogram of the mass for N-acetylhistidine from two different human urine extracts (black and red traces respectively) from UMR data (A) and HRAM data (B). Precise mass and mass windows used are labeled on each panel. The added mass resolution and accuracy of the HRAM data stream permitted the detection of the difference in concentration of N-acetylhistidine between these two samples that was masked in the noisier UMR data. This data was reproduced on an alternate HRAM data stream instrument to confirm finding (data not shown). |