 |
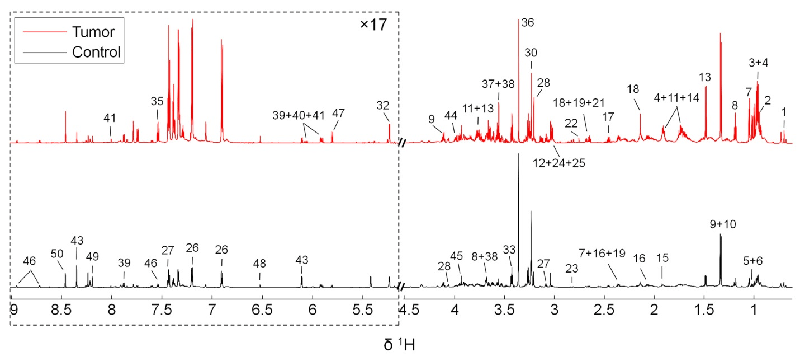
| Figure 1: 800 MHz liquid state 1H NMR metabolite spectra of the hydrophilic extracts of stomachs excised from the control (black) and the melanoma mice (red). The peak intensities were normalized to per unit weight of tissue before extraction. The dotted regions were vertically expanded 17 times as denoted in the figure. A total of 50 metabolites were identified with metabolite numbers, i.e. the metabolite keys shown in Table 1 |