 |
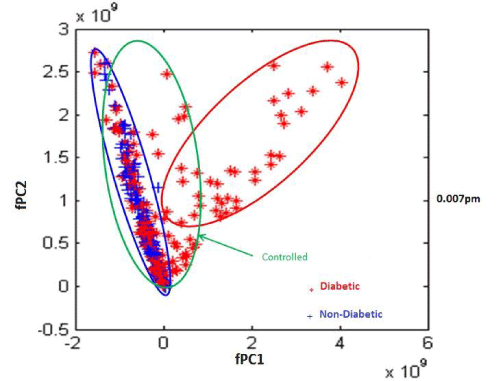
| Figure 3: The X axis represents projection on the first flexible principal component and the Y axis represents the orthogonal component. Clustering of the blue stars to the left of the zero line indicates the urine metabolomic diagnostic test is highly sensitive in determining the presence of diabetes disease. (Blue: Nondiabetic, Red: Diabetic) |