 |
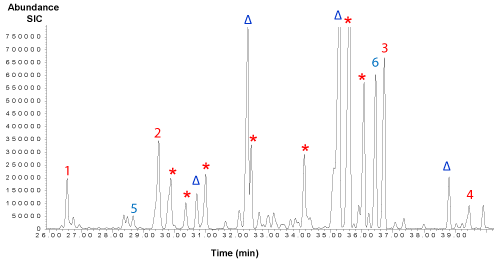
| Figure 2: A detailed representative GC/MS post-run ion m/z 55 selected ion (SIC) metabolite profile of the dental biofilm obtained from the lesion region. 1,2,3,4: Tentatively identified branched alcohol peak areas which were used for quantitative comparisons; 5,6: tentatively identified ester peak areas which were used for quantitative comparisons. *additional tentatively identified branched alcohols, Δadditional tentatively identified esters. |