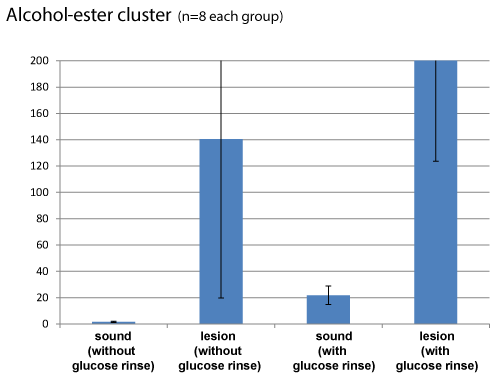
Figure 4:
Averages of normalized peaks areas against internal standards and per mg of the sample weight in samples from C-A children from sound or lesion surfaces. Error bars indicate standard deviation (n=8).