 |
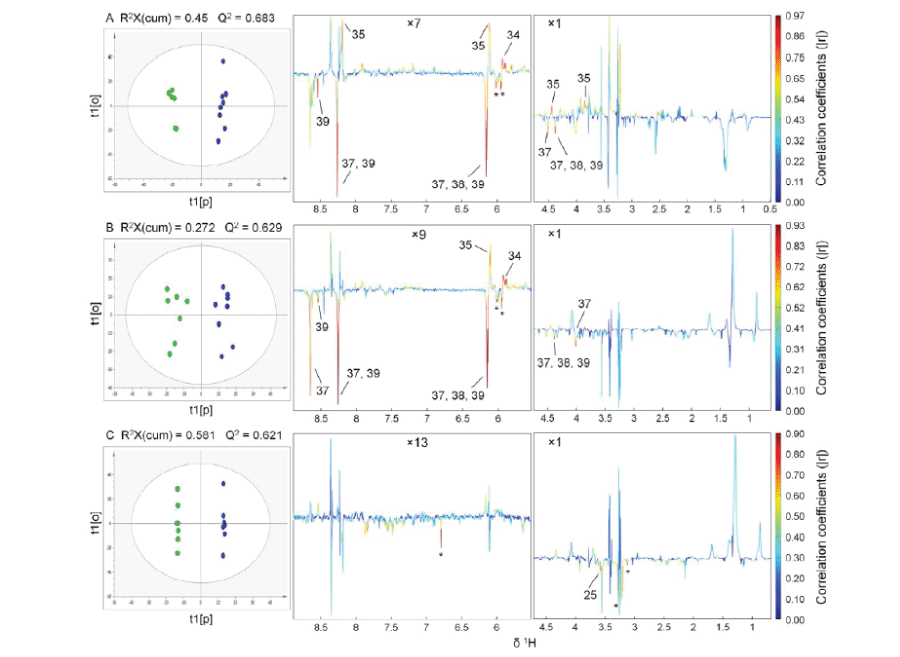
| Figure 2: OPLS scores (left) and coefficients-coded loadings plot (right) of the model discriminating the control (green dots) and the experimental (blue dots) groups: A, RW-SC (control) vs RW-MS (experimental); B, OB-SC (control) vs OB-MS (experimental); C, RW-MS (control) vs OB-MS (experimental). Other model parameters: A, R2(cum) = 0.99, R2Y(cum) = 1; B, R2(cum) = 0.945, R2Y(cum) = 1; C, R2(cum) = 1, R2Y(cum) = 1. CV-ANOVA results gave p values of 0.059, 0.029 and 0.348 for models A, B and C, respectively. Regions were vertically expanded as denoted in the figure. “Asterisks” indicated unassigned peaks. Metabolite keys were shown in Table 1. |