 |
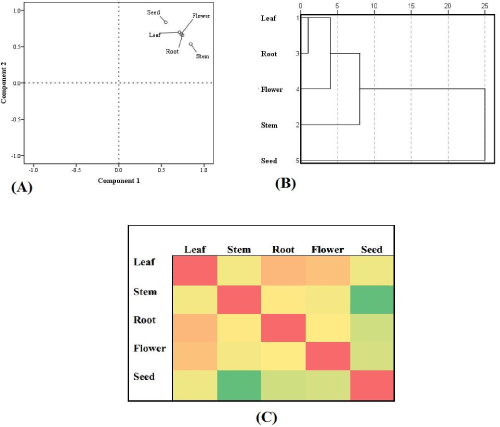
| Figure 6: Multivariate statistical analysis of the phytochemical profiles of C. infortunatum leaf, stem, root, flower and seed. (A) Principal component loading plot corresponding to Table 1. Clustered spatial arrangement of leaf, flower and root in the double positive quadrant signifies comparable phytochemical profile whereas, unalike profile in case of seed and stem. (B) Dendrogram describing the hierarchical clustering of the phytochemical profiles. Phytochemical profiles of leaf, root and flower remains similar as shown by the clustered branching pattern. However, separation of the phytochemical profile of seed from the very beginning demonstrates highest variation. (C) Proximity heat map generated from proximity scores corresponding to Figure 1B. Shades of red to green colour demonstrates low to high proximity scores. Highest proximity phytochemical proximity resided between root and leaf whereas, lowest proximity between seed and stem. |