|
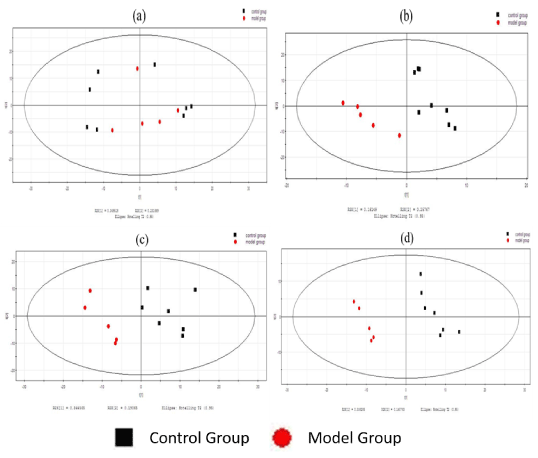
| Figure 1: (a) PCA score plot between control group and model group of serum. (b) PLS-DA score plot between control group and model group of serum. (c) PCA score plot between control group and model group of liver. (d) PLS-DA score plot between control group and model group of liver. |