 |
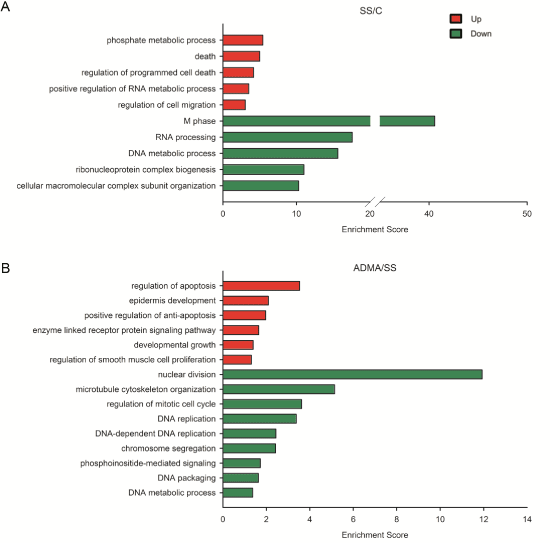
| Figure 2: Enriched GO terms by serum starvation and ADMA treatment for 96 h. (A) The top 5 enriched GO terms in up- and down-regulated genes by serum starvation treatment. (B) The all enriched GO terms in up- and down-regulated genes by ADMA treatment compared to serum starvation treatment. |