 |
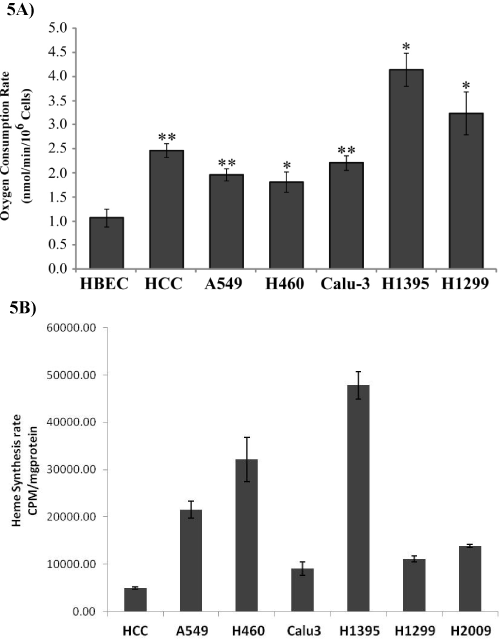
| Figure 5: The rates of oxygen consumption and heme synthesis are increased in NSCLC cells. Differential levels of rates of oxygen consumption (A), and heme synthesis (B) in various NSCLC cell lines. For statistical analysis, the levels in cancer cells were compared to the levels in normal cells (HBEC), by using Welch 2-sample t-test. * p value 0.05; ** p value 0.005. |