|
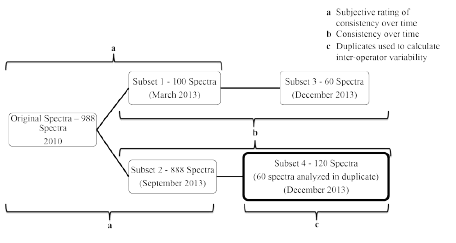
| Figure 1: Diagram of spectral analysis timing and relationship to subsets. The original data was profiled in 2010 (988 spectra). Subset 1 consists of 100 spectra originally profiled in 2010, re-profiled in March 2013. Subset 2 consists of 888 spectra originally profiled in 2010, re-profiled in September 2013. Both Subset 3 and Subset 4 contain 60 spectra profiled a third time in December 2013. The Subset 3 spectra were all drawn from within Subset 1, while Subset 4 was drawn from within Subset 2. (a) Both Subset 1 and Subset 2 are used in the subjective rating of consistency over time. (b) The comparisons of Subset 1 to Subset 3 and Subset 2 to Subset 4 represent the quantitative consistency over time analysis. (c) The 60 spectra from Subset 4 were profiled in parallel by two different operators, and these duplicates were used to calculate interoperator variability. |