 |
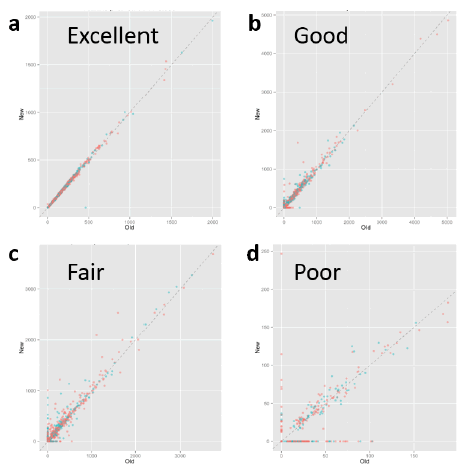
| Figure 2: Illustrative plots for each of the four subjective categories.(a) Excellent (L-alanine), (b) Good (taurine; HMDB00251), (c) Fair (p-methylhistidine; HMDB00001), and (d) Poor (3-hydroxyphenylacetate; HMDB00440)) plots of metabolite concentrations at two different time points. Concentrations on the y-axis (New) are from 2013, while concentrations on the x-axis (Old) are from 2010. |