 |
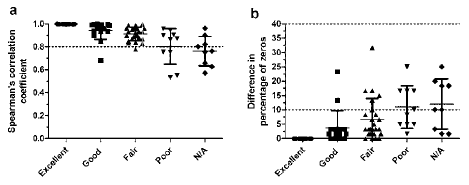
| Figure 3: Correlation and difference in percentage zeros seen with the comparison of inter-operator variability in the subjective groups. (a) Spearman’s correlation coefficient (rs) was calculated from plots of metabolite concentrations determined from analysis done by two different operators. (b) Difference in percentage zeros between the two operators. The grey shaded area in represents metabolites that are identified as potentially variable in all graphs (a) rs<0.8 and (b) difference in percentage of zeros >10. The metabolites rated subjectively in Table 1 retain their grouping here. N/A is Not Analyzed. Error bars represent standard deviation of the values. |