 |
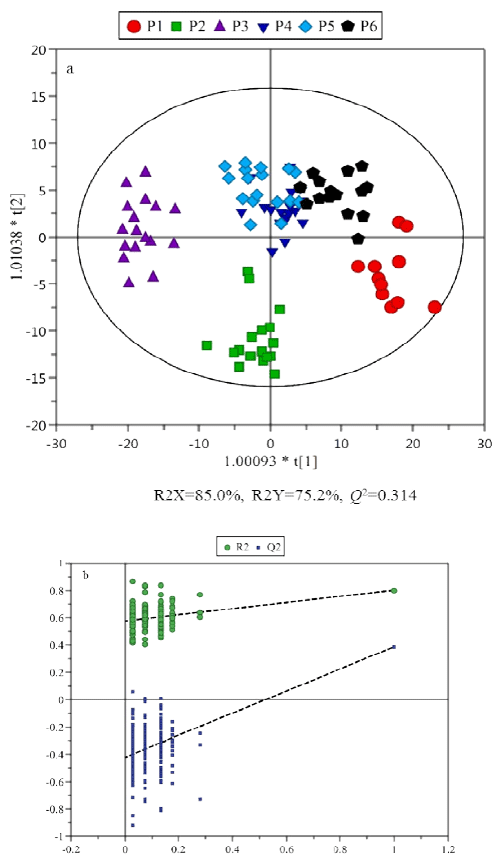
| Figure 2: OPLS-DA Score Plot of the Six Collections over 520 Days. a, data from different period were marked by varied symbol styles and color codes: 1st period (red circle), 2nd period (blue box), 3rd period (turquoise triangle), 4th period (purple inverted triangle), 5th period (blue diamond), and 6th period (black pentagon); b, Permutations plot for O2PLS-DA Model with 200 iterations. The green and blue line each represents regression line of R2 and Q2 value, then all blue Q2-values to the left are lower than the original points to the right and the blue regression line of the Q2-points intersects the vertical axis (on the left) below zero, thus strongly indicating that the original model was valid. |