 |
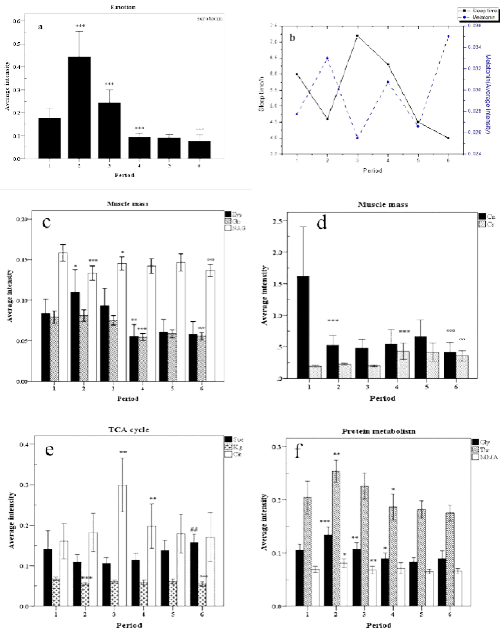
| Figure 3: Line and Bar Plots of Different Biomarkers Conjunction with a Significant Level. Significant level between two continuous period: *p<0.05, **p<0.01 and ***p<0.001; comparing with period two: #p<0.05, ##p<0.01 and ###p<0.001; and comparing period six with period one: °p<0.05, °p<0.01 and °p<0.001. One-way ANOVA with posthoc Bonferroni test). Data of sleep time was derived from the first volunteer and this data was provided by Ke Lv, et al. |