|
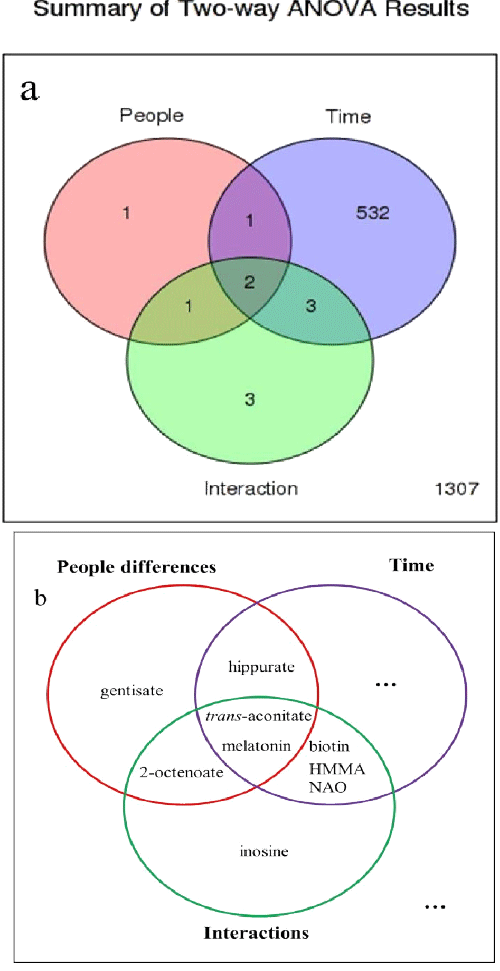
| Figure 4: Important Features Selected by two-way ANOVA. Each circle represents a factor (people differences or time since isolation) which have great effects on data variation or the major patterns associated with interaction. a, numbers in this figure refers to the significant chemical shift; b, metabolites assigned according to chemical shift in a. |