 |
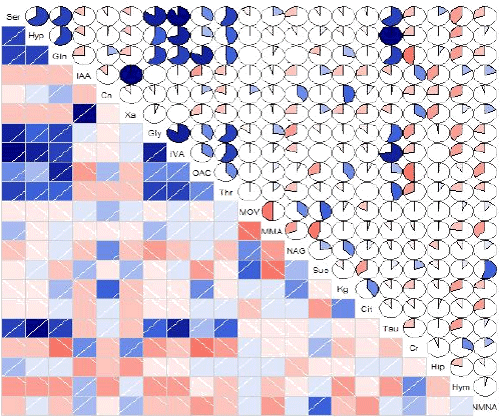
| Figure 5: Correlogram of Biomarkers Intercorrelations. Color code: blue is the strongest positive association; red is the strongest negative association. Color gradient from red to blue presents Pearson correlation coefficient from -1 to 1. Area in upper triangular pie shows a positive association if it sweeps in a clockwise. Otherwise, it presents a negative association. The size of filled area presents the value of Pearson correlation coefficient. |