 |
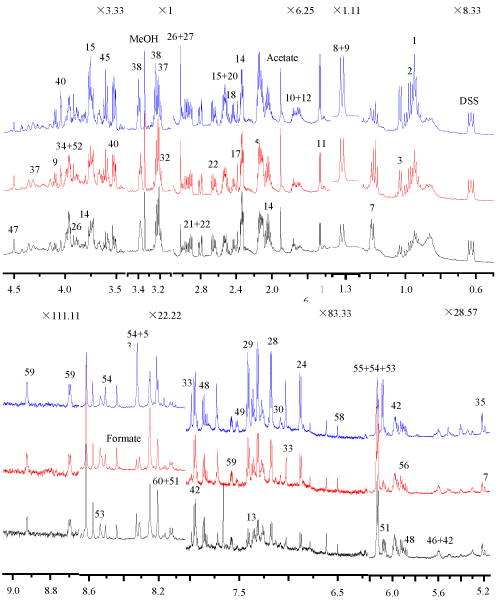
| Figure 1: 600 MHz liquid state 1H NMR metabolites spectra of the hydrophilic extracts of spleens excised from the control and the radiation exposure mice. The peak intensities were normalized to per unit weight of spleen before extraction. In this plot, spectral regions between different chemical shifts are vertically expanded by different times to highlight the peaks of varied spectral intensities. Black: control, red: 3 Gy, blue: 7.8 Gy. |