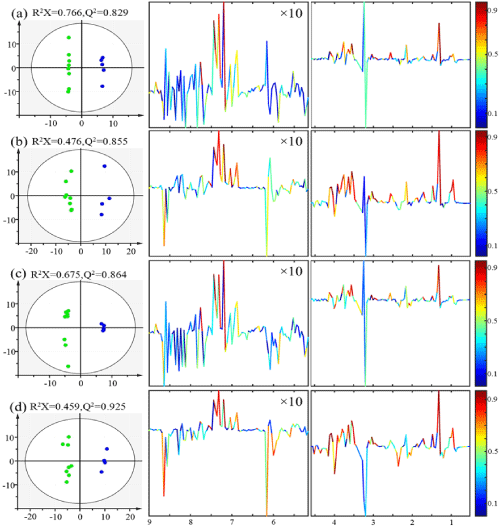
(a) Data derived from binning results of control and 3 Gy and normalization to unit weight,
(b) Data derived from binning results of control and 7.8 Gy and normalization to unit weight,
(c) Data derived from binning results of control and 3 Gy and normalization to constant sum,
(d) Data derived from binning results of control and 7.8 Gy and normalization to constant sum. CV-ANOVA results gave p values of 0.095, 0.046, 0.02 and 0.005 for models (a), (b), (c) and (d), respectively.