|
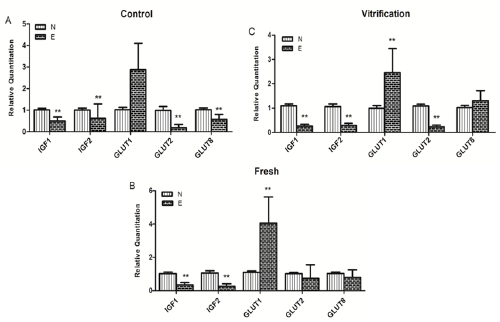
| E: 14.5 dpc embryo; N: Newly born mice. A: Control group; B: FET group; C: VET group. **P < 0.01 versus newly born mice. |
| Figure 5: The expression of Igf1, Igf2, Glut1, Glut2, Glut8 genes in livers of 14.5 dpc offspring and newly born mice from FET, VET and control groups. |