 |
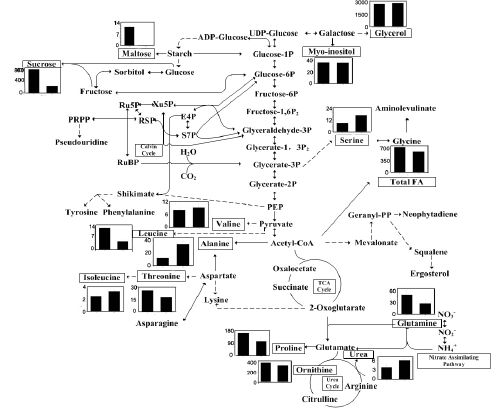
| Figure 3: Diagram showing changes in metabolite abundance mapped onto the metabolic network, including the Calvin cycle, the TCA cycle, amino acid metabolic pathway and other pathways. The left of each column diagram is -N condition, the right is CM condition. |