 |
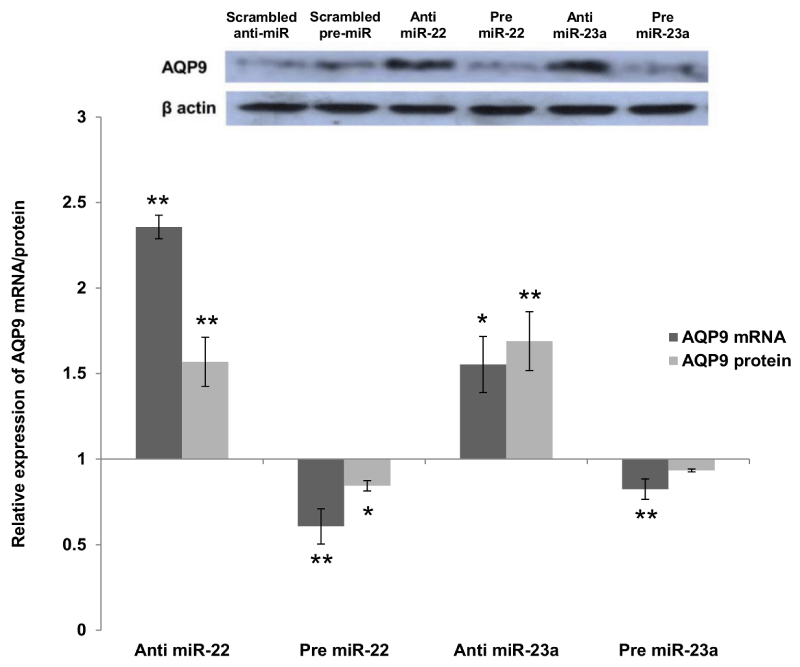
| Figure 3: Relative expression of miR-22, miR-23a and AQP9 in HepG2 cells transfected with either anti- or pre- miR-22 or miR-23a (30 nM). Data was normalized against the housekeeping gene 18S RNA and presented as mean ± SEM (n=3) against control cells transfected with corresponding anti or pre scrambled miRNAs. Western Blot analysis of AQP9 protein in treated HepG2 cells is also shown (see insert). β-actin was used as loading control. The data presented here is a representative of three independent experiments. Statistically significant differences are tested at p< 0.05 significance. *p< 0.05, **p< 0.01. |