 |
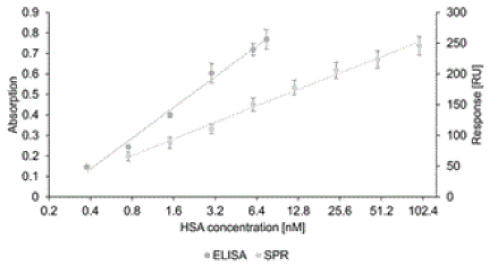
| Figure 5: Calibration curves obtained with SPR (R2 = 0.9923, ΔRU = 38.65 × ln[HSA] + 75.539) and ELISA (R2 = 0.9912, Δabsorption = 0.267 × ln[HSA] + 0.3329. Error bars indicate standard deviations of means obtained from six replicates using SPR and two replicates using ELISA. In SPR measurements signals obtained using the reference BrdU-specific antibody were subtracted from those obtained using the HSA-specific antibody. |