 |
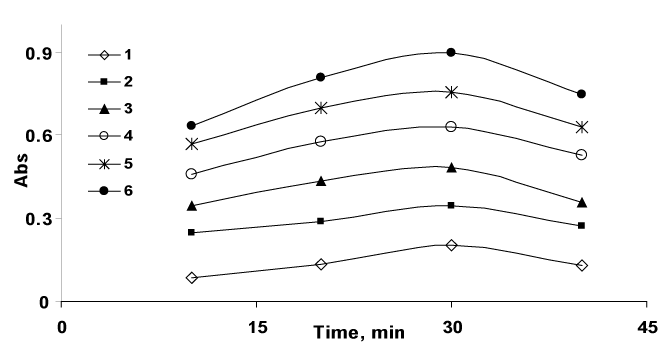
| Figure 3: Absorbance vs. time graphs for the reaction of etilefrine hydrochloride and NBD-Cl, at fixed concentration of NBD-Cl and different concentration of etilefrine hydrochloride (1) 1.38 x 10⁻⁵; (2) 2.29 x 10⁻⁵; (3) 3.22 x 10⁻⁵; (4) 4.13 x 10⁻⁵; (5) 5.05 x 10⁻⁵; (6) 5.97 x 10⁻⁵ M of the studied drug. |