 |
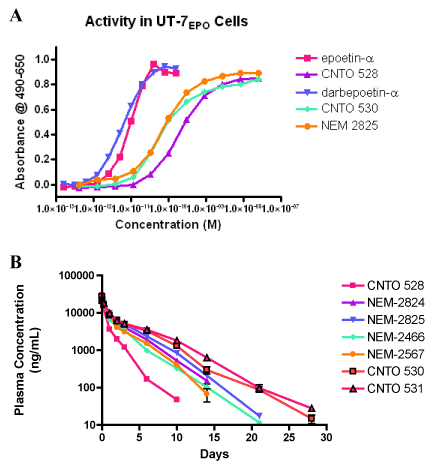
| Figure 2: A) Activity of epoetin-α, darbepoetin-α and selected EPOMIMETIBODYTM constructs in the UT-7EPO assay. epoetin-α and darbepoetin-α show similar potencies while the EPO-MIMETIBODYTM constructs although full receptor agonists are less potent. These data were used to calculate the EC50 values presented in Table 1. B) Plasma concentration vs. time plot for the EPO-MIMETIBODYTM constructs. These data were used to calculate the pharmacokinetics parameters presented in Table 1. |