 |
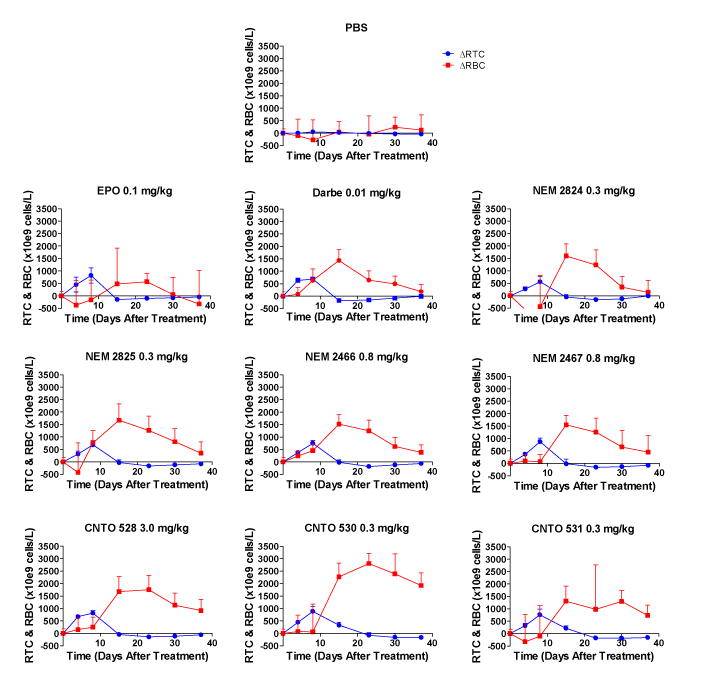
| Figure 5: Relationship between reticulocytosis and increase in RBC. Doses that caused an approximate 1000 cells/L peak increase in RTC were parsed from the dose response dataset and plotted with their corresponding increase in RBC. Data are expressed as group mean (n=6) change from baseline. Data for RBC are corrected for reticulocyte count and expressed as 106 cells/L. Despite the very similar peak reticulocyte counts, there is an appreciable difference in the resulting change in RBC; epoetin-α causing almost no change in RBC and CNTO 530 causing a marked increase. |