 |
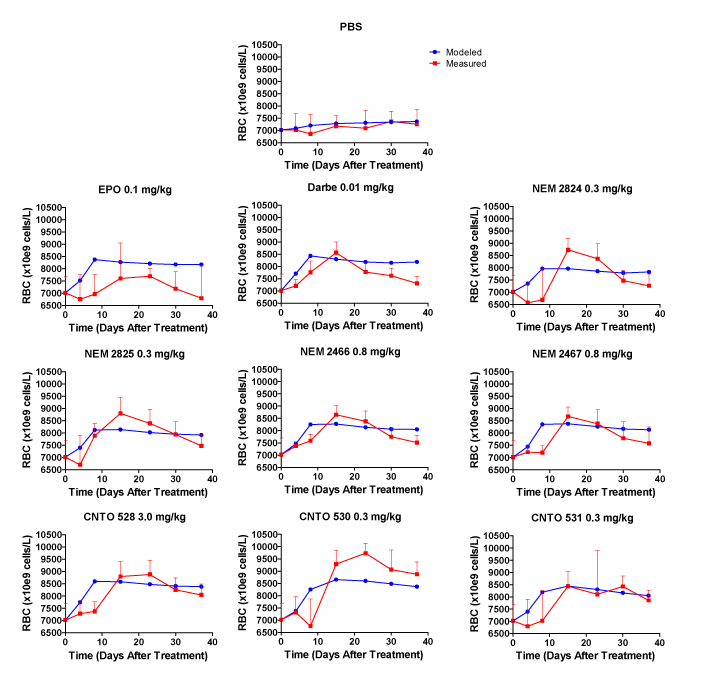
| Figure 6: Modeling of the conversion of RTC to RBC at dose that cause a similar increase in RTC. The model is describe in Materials and Methods and assumes no loss in RTC and a 2% loss in RBC. The model closely follows the measured RBC values for the control mice and most EPO-MIMETIBODYTM constructs. In contrast, the model overestimates the measured response for epoetin-α, but underestimates the response to CNTO 530. |