 |
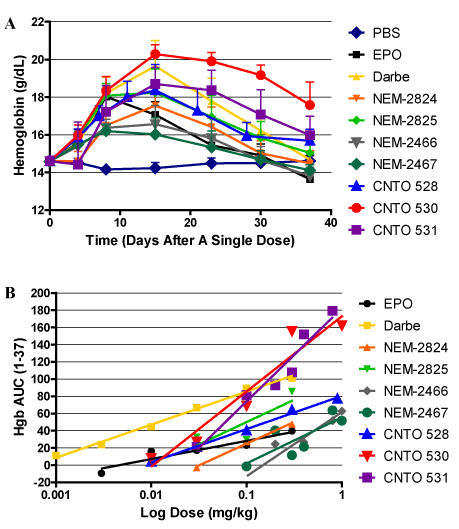
| Figure 7: A) Mean Hgb response over time. Data are shown for the effects of the various EPO-R agonists at a dose of 0.3 mg/kg. These data were used to calculate the area under the curve for Hgb at that dose. B) Data for Hgb AUC(1-37) for the complete dose response dataset are shown as a function of log10 of the administered dose. |