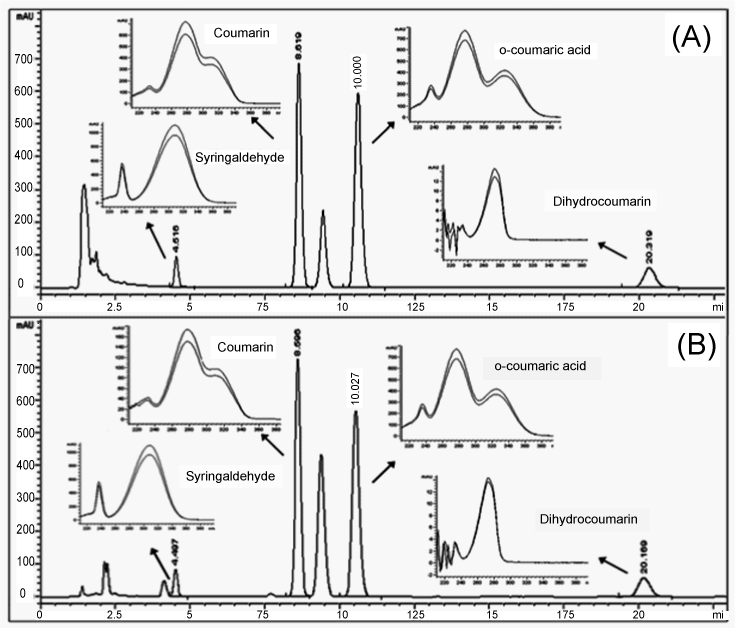
Figure 2:
Chromatograms from selectivity study in (A) syrup matrix and (B) oral solution matrix.