 |
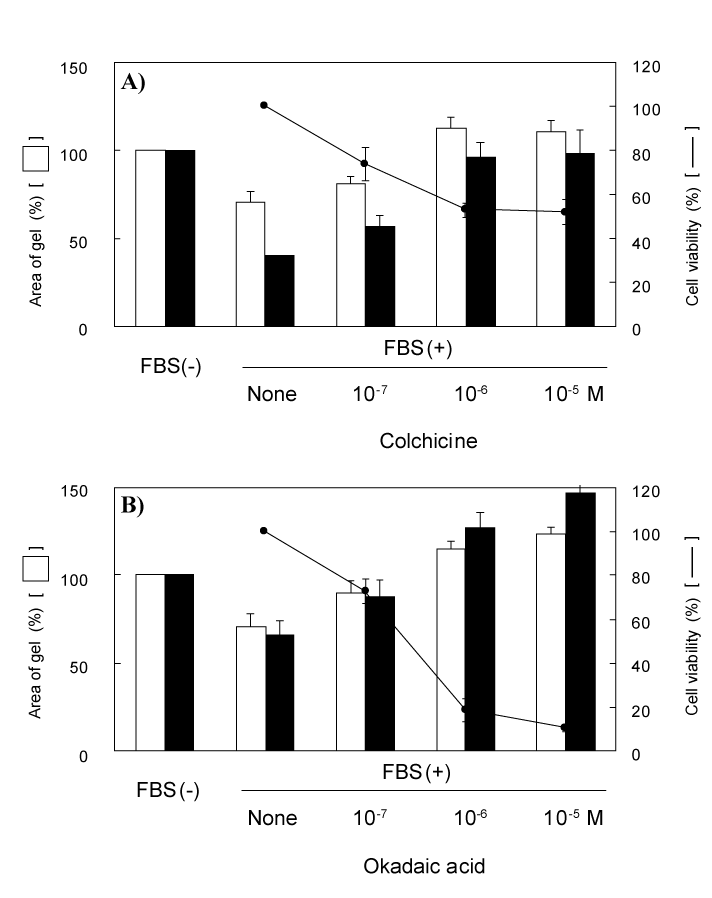
| Figure 6: Effects of colchicine (A) and okadaic acid (B) on collagen gel contraction induced by 0.5% or 2% FBS and on cell viability. Various concentrations of inhibitors were added and cells were cultured on collagen gels in the presence of FBS at a concentration of 0.5% or 2%. The areas of collagen gels were measured and data are shown as % of collagen gel area without FBS. Open bars indicate 0.5% FBS-stimulated contraction and solid bars indicate 2% FBS. Symbols, “-” or “+” indicate absence or presence of FBS. Dotted line indicates cell viability (%). Data represent the mean ± SE of triplicate measurements. ***P < 0.005 versus 0.5% FBS alone. #P < 0.05, ###P < 0.005 versus 2% FBS alone. |