|
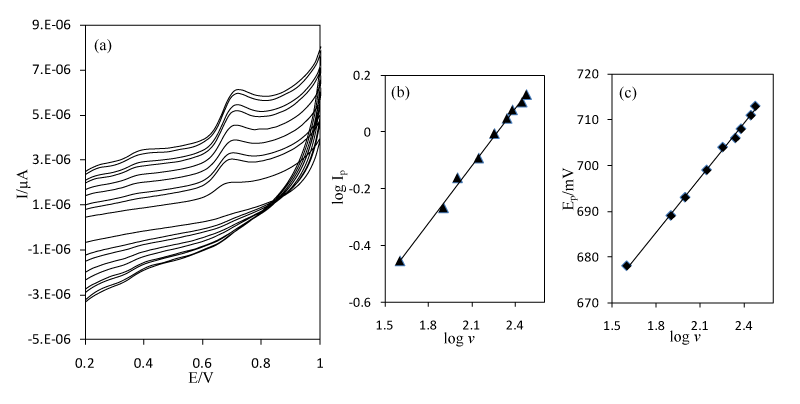
| Figure 4: (a) Cyclic voltammograms of 1000 ng/mL of mefenamic acid at MWCNTs-G/Ag in buffer solution (pH 5) in various scan rates (from inner to outer); 40, 80, 100, 140, 180, 220, 240, 280 and 300 mV/s. (b) Relationship between the peak currents (Ipa) vs. square root of scan rates (c) Relationship between square root of scan rate and peak potential |