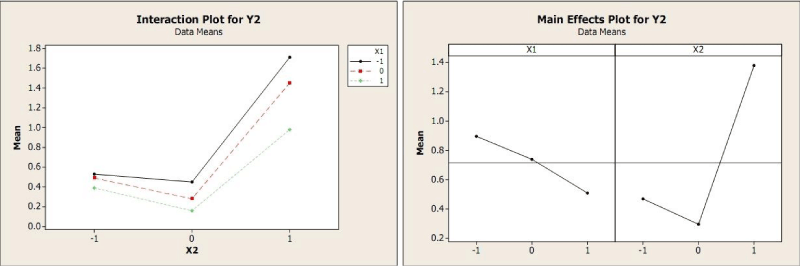
Figure 11:
Right:
Plot showing the level of interactions b/n the X
1
and X
2
at various Concentrations.
Left:
Plots showing the effect of individual concentration of X
1
and X
2
on % Friability.